TATER: Tamper Analysis via Transient Electromagnetic Response
TATER is a tamper analysis system that monitors deterministic computer programs and detects unauthorized modifications. The TATER system functions when placed in close proximity to the target proessor. It works by capturing and comparing electromagnetic emanations from a target processor by using a correlation algorithm. The value of this project is that it can verify code integrity without requiring modification to the target software or hardware.
| Sponsors | Client declined to be named |
| Duration | Fall 2017 - Spring 2018 |
| Mentor |
|
| Faculty Advisor |
|
| Team Name | TATER Tots |
| Team Members |
|
Problem Statement[edit | edit source]
Background[edit | edit source]
In some situations, it may be impractical to physically modify a system in order to monitor it. Whether due to financial matters or system dependencies, this may worsen the severity of existing vulnerabilities since successful exploitation of these vulnerabilities may not be identified for days, or even years. The goal of TATER is to verify code integrity without requiring modification to the target system. It works in close proximity to the target processor by monitoring electromagnetic signals emanating from the processor and correlating them with an established baseline from code that is "known" to be good.
Specifications[edit | edit source]
Our product should not require modification of the target system. It should be sensitive enough to detect relatively small changes in the boot code but flexible enough to allow multiple configurations. It should be possible to update the monitoring system to continue correctly characterizing the boot code if it is updated. Analysis should take no longer than a couple of minutes.
Design[edit | edit source]
Alternatives and Decisions[edit | edit source]
Over the course of extensive testing and experimentation, we determined that the system design would include an antenna, an amplifier, an oscilloscope, and computers for both programming and analysis. As an alternative to the oscilloscope, we considered using an FPGA and ADC for faster data transfer at the cost of a lower sampling rate. However, this was not possible because the FPGA and ADC available to the team were incompatible. Here is a diagram of the final system design.
The antenna is an RF Explorer H-Loop and primarily measures fluctuations in power draw through the processor. These signals are sent through an amplifier to the oscilloscope, where the data is stored until it can be transferred in a .csv file format over ethernet to the analysis computer. From there, it is run through the analysis algorithm and an output of success or failure is produced based on the percentage correlation between the capture and a previously-established baseline.
Antenna Design[edit | edit source]
The antenna design will be centered around the most important data in the signal rather than all of it, with a bandwidth ranging from 1-250MHz. This range of frequencies is difficult to obtain under limitations of cost and available volume to house the antenna. Because of this, the team initially intended to design an antenna. However, limitations in the available antenna design software made the problem intractable and the team resorted to considering the options available for purchase.
Previous Antenna Design Considerations[edit | edit source]
|
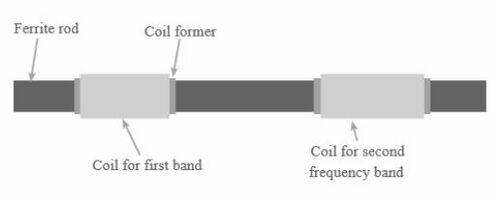
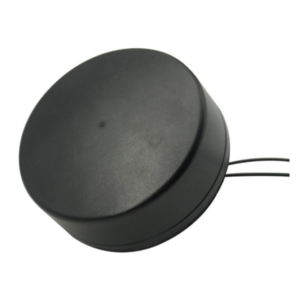
A number of different antennas were considered over the course of the project. Descriptions of benefits and tradeoffs with each design are left to demonstrate the learning process and explain key design decisions. Ferrite Rod[edit | edit source]
In the end, it was decided that the Ferrite Rod antenna was too large to use for the purposes of this project. Pulse Larsen Outdoor Multi Band Antenna[edit | edit source]
The Pulse Larsen was considered too large, in spite of its bandwidth and gain, and as such was unable to be implemented. RF Explorer H-Loop Antenna (RFEAN2)[edit | edit source]
The final design to be considered, this Antenna is comparable both in terms of bandwidth and gain to our probes, while being much more affordable. Because of these reasons, this is the antenna we decided would be implemented in the design. Hardware Design[edit | edit source]The hardware design went through several different versions as alternatives were considered and tested and improvements were made. One possible setup involved streaming data from the antenna through an FPGA and ADC in order to collect captures more quickly. Unfortunately, the FPGA development board and ADC were incompatible and the team was not able to resolve these incompatibilities in the time available. For the final design, the team decided to incorporate an oscilloscope and send data to the analysis computer over ethernet. The downside to this arrangement is that it takes approxiately 90 seconds to send a capture of the test boot code, as opposed to 20-30 seconds. Furthermore, the oscilloscope is limited to a certain number of captures which requires the boot code to be shorter than normal, which is why the team wrote custom boot code. However, the FPGA and ADC setup would have faced other challenges with a lower sampling rate. In the end, the hardware setup involving the oscilloscope produced excellent results and served the purpose of developing and testing proof-of-concept code. Future projects based on this one might reconsider a setup involving an FPGA and ADC.
Electromagnetic Signal Captures[edit | edit source]
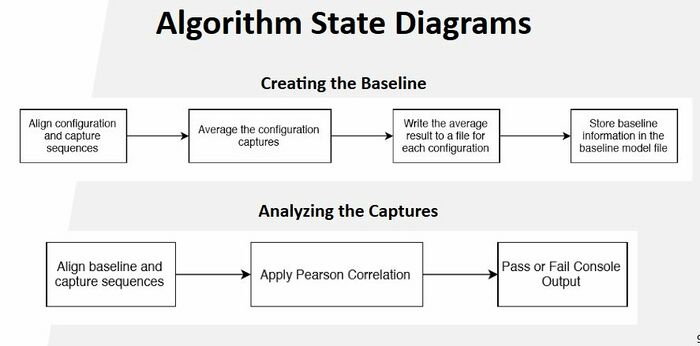
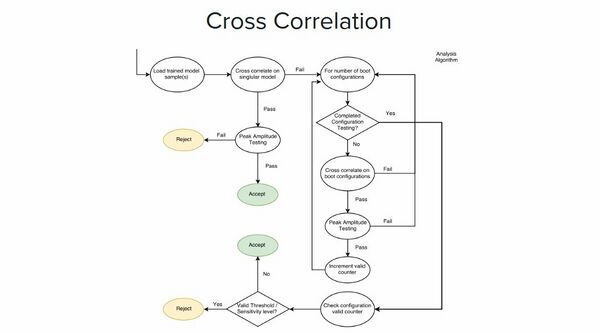
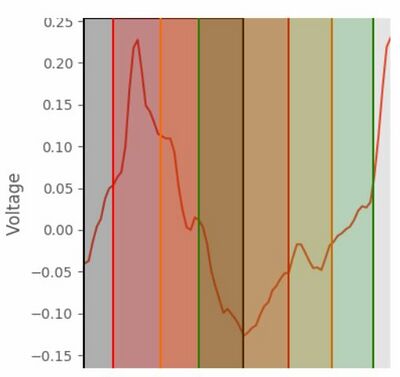
Algorithm Design[edit | edit source]We use cross correlation to align our waveform sequences. We then normalize the data using the highest and lowest values and correlate the capture sequence with an established baseline created from multiple captures. The correlation is done over short segments of the data, called windows, which overlap. For correlation, we are using Pearson correlation which allows us to compare the locations of peaks over time and produce a percentage representing the similarity between the sequences. At this point, we have created a proof-of-concept program that correctly recognizes when code has been modified by inserting or deleting instructions. Repeated captures over the same sequence consistently produce a correlation of >93%. We are only able to detect single assembly-level instruction changes if they are dissimilar - say an ADD and a MOV, for instance. Replacement of similar instructions with each other, such as a MUL 0 with a MUL 3 are not detectable. The difference between them is indistinguishable from the normal variation between captures caused by external noise and imprecise equipment. Data Pre-Processing[edit | edit source]At this point, the only pre-processing that is done is aligning the signals to start at the first peak. This was previously done by filtering out all values below a certain level until the first high value occured, recognized as significantly about the average of the first several thousand signals. We are transitioning to using cross correlation to align the sequences, since the sampling rate has been decreased and it is no longer possible to match the locations of the first peaks as closely as necessary. Cross Correlation for Alignment[edit | edit source]
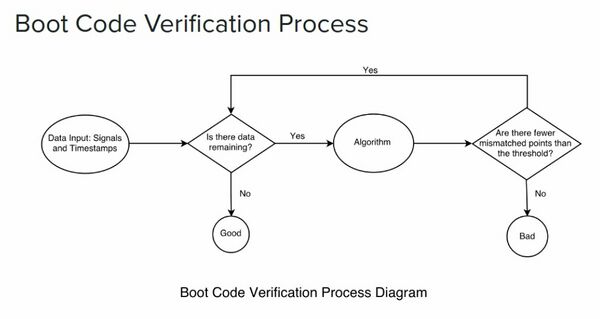
Boot Code Verification Process[edit | edit source]
Complications and Challenges[edit | edit source]
Implementation and Testing[edit | edit source]A probe and oscilloscope are used to capture electromagnetic signals emanating from the target processor. Captures from the same sequence of code produce a correlation of >99%, which is excellent. If instructions are added or removed, then this correlation falls significantly and the algorithm can detect these changes. Currently, we are able to detect single assembly-level instruction changes only if the instructions being modified are significantly different - such as replacing and ADD with a MOV. Changing an ADD to a much more similar SUB, on the other hand, is not significant enough for our current algorithm to register the difference. Complications such as background noise picked up along with the legitimate code emissions account for the <1% variation between captures on the same sequence of code, which makes it much harder to identify tiny changes such as replacing an ADD with a SUB as mentioned. Fortunately, most modifications would require multiple instruction changes in order to accomplish the intended purpose.
Initial Testing and Development Setup[edit | edit source]
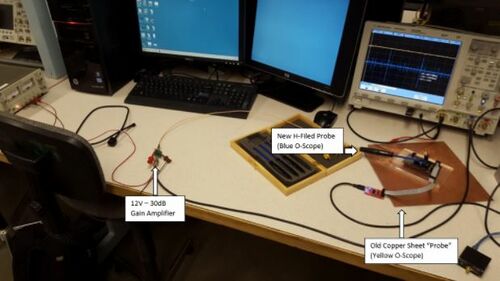
Final Hardware Setup[edit | edit source]
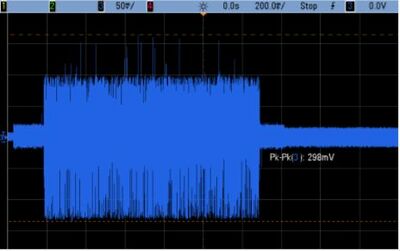
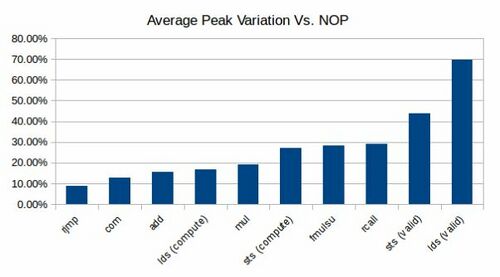
Test Results[edit | edit source]To the left is an example of the signals being captured by the oscilloscope. To the right is a graph showing the difference in peak amplitude between the signals produced by specific (labeled) instructions and a NOP (no operation) instruction.
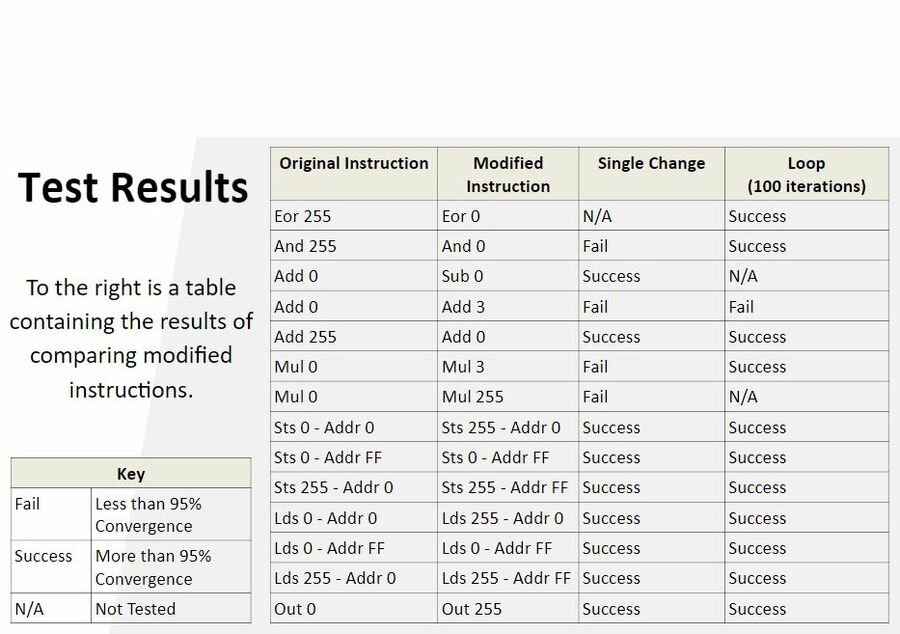
Below is a table containing the results of correlating captures with single instruction modifications. Testing was also conducted on loops containing 100 repetitions of an instruction, which as can be seen below did in some case impact the result. Conclusion and Final Thoughts[edit | edit source]The TATER system successfully detects insertions and deletions of instructions, as well as a large subset of single instruction modifications. The accepted correlation rate can be set such that good code is not rejected. While the system is sensitive to its environment, if the baseline is established from the same setup as will be tested later and external noise does not change drastically, desirable results are consistent. Team[edit | edit source]Document Archive[edit | edit source]Project Schedule[edit | edit source]Meeting Minutes[edit | edit source]File:Meeting Minutes 20170906.pdf File:Meeting Minutes 20170908.pdf File:Meeting Minutes 20170913.pdf File:Meeting Minutes 20170914.pdf File:Meeting Minutes 20170920.pdf File:Meeting Minutes 20170927.pdf File:Meeting Minutes 20171004.pdf File:Meeting Minutes 20171011.pdf File:Meeting Minutes 20171018.pdf File:Meeting Minutes 20171025.pdf File:Meeting Minutes 20171101.pdf File:Meeting Minutes 20171108.pdf File:Meeting Minutes 20171115.pdf File:Meeting Minutes 20171129.pdf File:Meeting Minutes 20171206.pdf File:Meeting Minutes 20180110.pdf File:Meeting Minutes 20180117.pdf File:Meeting Minutes 20180124.pdf File:Meeting Minutes 20180130.pdf File:Meeting Minutes 20180214.pdf File:Meeting Minutes 20180221.pdf File:Meeting Minutes 20180302.pdf File:Meeting Minutes 20180307.pdf File:Meeting Minutes 20180321.pdf File:Meeting Minutes 20180330.pdf File:Meeting Minutes 20180404.pdf File:Meeting Minutes 20180411.pdf File:Meeting Minutes 20180418.pdf File:Meeting Minutes 20180425.pdf File:Meeting Minutes 20180502.pdf Presentations and Monthly Status Reports[edit | edit source]Other Project Documents[edit | edit source] |

