Fuel Cell VOC Filtration Monitoring System
| 2020 - 2021 Engineering Capstone Project | |
| Duration | Fall 2020 - Spring 2021 |
| Team Name | Hevel |
| Members |
|
| Faculty Adviser |
|
| Mentor |
|
| Sponsors |
|
| Client |
|
Fuel cells exist as an alternative and cleaner power source option to fossil fuels, but as a product they tend to be a delicate mix of expensive, hard to replace, and easy to break. One of the ways they’re most susceptible to damage is airborne contaminants, with things like smoke, exhaust, and solid particles in the air being able to make a single fuel cell completely useless via irreversible internal damage. To prevent this kind of damage, adequate filters are needed to keep the internals of the fuel cell protected, but testing said filters is a roadblock on its own. Currently, it costs our client around $5,000 per test per filter to test the effectiveness of various air filters when it comes to safeguarding their fuel cells. Our team’s test stand design would negate those costs almost entirely and make testing easy and efficient in terms of both time and cost, as our design includes easy access to the filter housing so multiple filters can be swapped in and out for individual tests without the need of separate setups, as well as integrated data collection and readout to allow faster and easier-to-understand results.
Background[edit | edit source]
Hyster - Yale is a company that builds forklifts, and, in these forklifts, they are beginning to work with Nuvera fuel cell stacks. Forklifts are often used in places such as shops, warehouses, and factories. In these locations there are high amounts of volatile organic compounds such as: toluene, isopropyl alcohol, and benzene. When the fuel stacks are exposed to these types of compounds it destroys the interior of the fuel cell and they must be replaced, however fuel stacks are expensive so they must remain intact and useful for as long as possible. To do this, filters are used to protect the fuel cells and filter the air, so a very little number of VOCs reach the fuel cells. The filters needed to be tested to ensure that they are adequate for the task at hand, however testing these filters is not an easy task. The current cost of one test per filter is about 5000 dollars and the filters must be sent away for testing. This test stand will allow Hyster - Yale for efficient and less costly in-house testing. This test stand has been worked on previously for the past two years, by two different capstone teams. Our team was given the previous work done by the other team with the exception of a couple key components. Our team was given the task to create a fully functional Volatile Organic Compound (VOC) filtration test stand that will monitor filter saturation. Our team’s test stand design would negate those costs almost entirely and make testing easy and efficient in terms of both time and cost, as our design includes easy access to the filter housing so multiple filters can be swapped in and out for individual tests without the need of separate setups, as well as integrated data collection and readout to allow faster and easier-to-understand results.
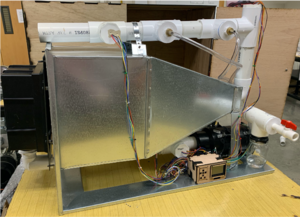
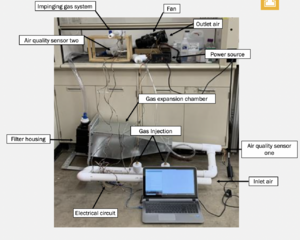
This project has been worked on previously for the past two years. The previous test stand implemented two air quality sensors to test the filters absorbance of the VOCS, and was powered with an ATX power source and Arduino Mega.
The photo also shown how the old test stand functioned with labels showing the different components.
Problem Definition[edit | edit source]
Our team is to design, build, and test a robust Volatile Organic Compound (VOC) filtration test stand that will monitor filter saturation and performance and can be operated and assembled by a technician. The filtration stand will have several design specifications in order to be both usable and reliable for testing filters. The complete this product our team laid out specific design constraints with tests to validate the constraints and a defined list of everything that the test stand must include to be fully operational. All specifications and constraints were discussed with and approved by Hyster – Yale client.
To design a test stand that is fully operational and meets all filter testing requirements our team used the ISO 11155-2 testing standards when designing and deciding what components the test stand requires, the standards can be found in the portfolio. The test stand utilizes low cost air quality sensors and a gas injection system. For testing the stand must be able to measure mass air flow, ambient air concentration, influent air concentration, and effluent air concentration. There must be at least three air quality sensors being used on the test stand at any point in operation to properly collect data, one for each type of air concentration. There must be one mass air flow sensor to ensure that the stand is producing quality air flow and applicable flow control. The design must also include a primary air mover such as a fan, appropriate ducting, a gas injection system that uses no heating or pressurized canisters, testing of multiple filters including different sizes and shapes, and a data acquisition system.
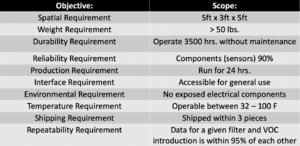
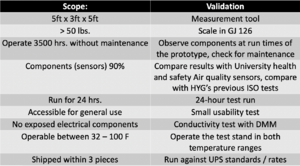
Key requirements were created by our team as well a validation test for each of the requirements. The tables describes each of the requirements, the scope for each of the requirements, and the validation test for each requirement.All of the requirements must be tested and approved before the design is completed and given to the client. Since this project spans from Fall of 2020 to Spring of 2021, most designing will take place during the fall while building and testing will take place in the spring.
Project Plan[edit | edit source]
This project took place over the school year of 2020 – 2021, our team was assigned this project in September with an end date in May. Our team was made up of three members, Matthew, Jessy, and Michael, all in our senior year graduating in the spring of 2021. Everyone on the team is majoring mechanical engineering. At the beginning of the project assignment we developed a team contract and agreed on our roles and responsibilities for the project for the entire year.
Dividing up the work equally was the best way to achieve success over the span of the project we each had responsibilities with the physical design as well as the portfolio and documentation on the project. Matthew had the responsibility to learn about the sensors and develop the code for testing for designing the enclosure and sensor mounts. He was also responsible for taking meeting minutes and organizing the portfolio. Jessy was given the responsibility of designing the electrical components box and coding and designing the user interface. She was also tasked with maintaining the budget and creating the implementation manufacturing plan and bill of materials. Michael was in charge of building the impinging gas modules, designed by the previous team with some slight modifications, and designing filter adapters. For documentation he was given the responsibility of creating a drawing package of the final design. Even though we were each given our own individual piece of the project we worked together to redesign the stand to be up to our requirements and collaborated to create the rest of the documentation for the project. To ensure that all of our individual components were completely and created effectively and successful we created a Gantt chart with start dates and completion dates with every task each member needed to complete, once the task was completed it was check by the other two members of the project to ensure success. There was a Gantt chart with the schedule for each of the semesters, this also includes who was assigned each task and can be found in additional documents.
To ensure the design was as successful as possible and the best ideas were implemented our team met twice a week, once a week with our capstone advisor, and once a week with our client. We discussed our ideas for the design in our meetings and were given assistance and by our instructor. Working with our instructor and client to develop the best concepts possible for the completion of this design.
Design Developments[edit | edit source]
All the documentation is linked at the bottom of the wiki page. This will inlcude the gantt chart, budget, manufacturing plan and BOM, and a user manual on how to properly use the device.
Test Stand Operation[edit | edit source]
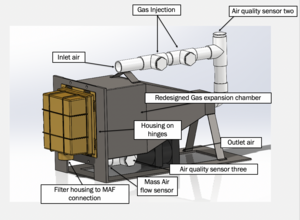
Ambient air flow enters the test stand at the inlet sight and is measured using our first SGP30 air quality sensor. This reading is read by the Arduino and stored on an SD card. The flow is then poisoned using the air flow from the impinging gas jets. There are two jets located on the stand allowing for two kinds of gas contaminants to be introduced. The flow mixes with the contaminants and a second air quality is read. In order to help calibrate the AQ sensor; pressure, temperature, and humidity sensors are deployed to get more accurate readings. This data is stored as the influent condition of the air. The air continues into the expansion chamber to create a more “Ambient-like” air condition where the filter media is introduced to the poisoned flow. The flow is filtered through the media and then a MAF reading is taken and stored on the SD card. The last air quality reading is taken and stored as the effluent condition, and the flow is then pushed out by the primary air movers, two fans. The speed of these fans is controlled by the Arduino using a MOSFET. This process is the backbone of the test stand and replicates the standard testing desired by HYG.
Initial Designs and Project Expectations[edit | edit source]
Hevel was given an inital test stand with the code, with the product requirements given by Hyster - Yale.
Final Design[edit | edit source]
Final Test Stand Overview[edit | edit source]
After considering all the previous iterations of the test stand, we 3D modeled a new expansion chamber that would be easier to seal and new piping that would allow for a more robust and minimalist approach to the stand. Additionally, a base was included so that all the components could be tied together on one platform. Adding to the robustness of the design. We also flipped the filter housing and planned for a removable plate. This allows the user to place any media desired to test in the associated filter adapter and then in the housing. The removable plate was the best way to create a tight seal in between the housing and the test stand.
Test Stand Including Enclosure[edit | edit source]
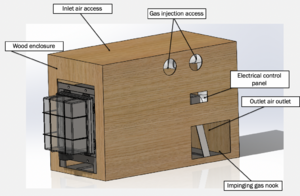
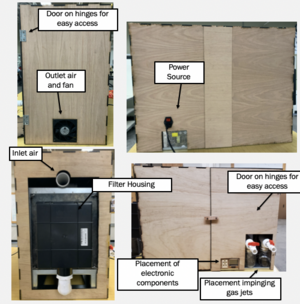
To add robustness and appeal to the overall test stand, an enclosure was designed to fit over all components. With air moving through, the enclosure would need to have specified cutouts that allowed for operation on the test stand. Thus, holes were made for the filter housing, inlet air, outlet air, the impinging jets, and electronics box. This is shown to the right. Additionally, a maintenance door was installed on the hinges purchased earlier for ease of access when adjusting parts as needed.
Impinging Gas Injection System[edit | edit source]
In order to introduce gas phase contaminants, the test stand deploys two impinging gas jets. The impinging jets use the concentration of air flow over a liquid surface to vaporize the liquid into gas phase particles, which then are carried through using the flow created by the primary air movers. This design was incepted by the previous team and made more robust by our team. Concentrations introduced is controlled by modifying the air flow. This is done by modifying the position of the ball valves in place. To help the user meet the desired poisoning concentration, the LCD screen displays the influent concentration moving through the stand at the given moment.
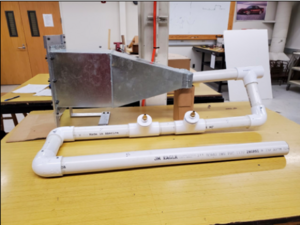
These photos show the impinging gas modules that we rebuild and how they sit in the stand. These modules worked effectively with our testing and the design was simple and easy to create. We used PVC components to build the modules and used a sealent to ensure that they worked properly.
Instrumentation[edit | edit source]
Hevel will be using two types of air quality sensors, we will be using the SGP30 and the BME680. Both of these sensors are from Adafruit, they are both low cost and have the features we need for this type of test stand.
SGP30:
- On Board Functions for TVOC, CO2eq, Ethanol, and H2 readings. Metal Oxide Sensor
- TVOC signal between 0 ppb to 60000 ppb. Hoping to run between 10ppm to 30ppm, within 32 ppb, max sampling rate 1 Hz
- Drift Behavior Given: 2.5 % of measured value at 30 ppm after 200 hours.
BME280:
- Relative Humidity readings within 32 to 140 F are within 4%
- Temperature readings within 32 to 149 F are within 1.0 C, max sampling rate 1 Hz
There will be three of each types of the sensors that are in three different locations.
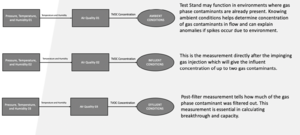
- Air sensors number one will be placed with the electrical components for testing the air quality of the ambient air for creating a baseline.
- Air sensors number two will be placed after the impinging gas nozzles to measure the contaminants in produced by what is being placed into the system.
- Air sensors number three is after the filter and before the exhaust fan to determine how well the filter worked.
The model before shows where air sensors two and three are placed on the test stand.
For the air sensor to get a proper reading they must be placed correctly in the test stand. The sensors have to be placed so they are able to get a good reading, to do this we designed sensor mounts and 3D printed them out of nylon, so that they will not melt when exposed to the contaminents during testing. The mounts are slide into the caps and the sensors are secured into place with screws.
User Interface[edit | edit source]
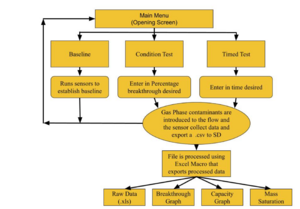
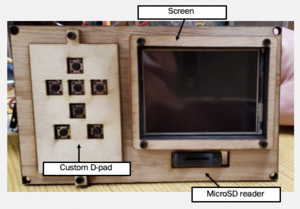
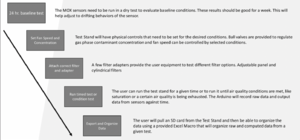
In order to make the test stand user friendly and easy to use we designed a user interface that would allow the user the ease of creating specified testing. We employed the use of an LCD screen and a button array so that the menus would be navigable. The testing allowed for the user to choose either a specified time or condition and then the test stand would collect and store data until that condition was met. It also allowed for use coaching and standalone operation.
The final design includes an easy to use user interface with a screen, D-pad, and MicroSD Card Reader to extract data. All of the electrical components will be intergrated to work as one system. The data will be stored on the Arduino and will be able to be exported.
The screen will include timed test, condition test, and baseline test. Timed Test:
- Start timed test
- Change the time
Condition Test:
- Start condition test
- Change the saturation percentage of the test
Baseline Test:
- Start baseline test
The following flow chart shows the process decription on how the user interface and the testing works. With decriptions for each testing type and how they work.
All of the electrical components will be placed inside of a laser cutted wood box. The top of the box will come off for easy access to all of the components. Images of the box and where the electronics box is placed are included the the enlcosure section.
The wires are all soldered into proto boards so they do not come unattached, however they are not soldered into the arduino so would be able to change out components or arduino using the wiring diagram and the code.
Standard Testing Procedure[edit | edit source]
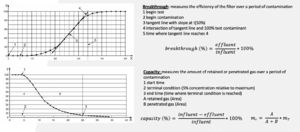
For testing validation Hevel used the ISO 11155-2 testing curves. These curves are for ideal tests and will be compared with our testing data. The image shows the graphs with descriptions.
The test stand is also built to replicate the testing standards. This chart shows why the air quality sensors are placed the locations they are and why there is an ambient, influent, and efluent sensors.
The flow chart shown show the standard testing procedure of the test stand. Hevel will be following the ISO 11155-2 testing standards.
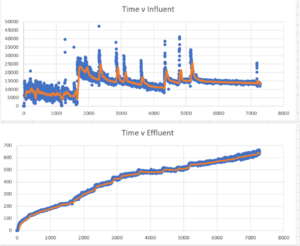
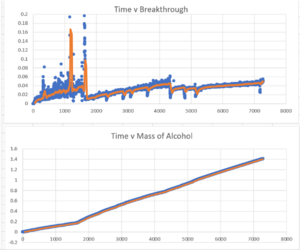
Here is an example of the our testing data from the final test stand. We only tested the filters to five percent. The following curves are Influent Vs. Time, Effluent Vs. Time, Time Vs. Breakthrough, and Time Vs. Mass of contaminant.
Team Members[edit | edit source]
| Matthew Murphy - Sweet
Major: Mechanical Engineering | ||
| Jessy Faulkner
Major: Mechanical Engineering
| ||
| Michael Eckert
Major: Mechanical Engineering
|
