INL Glovebox Tensile Testing System
| [[File:|300px|center|alt=]] | |
| Sponsor | |
| Team Name | Fits Like a Glove |
| Duration | Fall 2020 - Spring 2021 |
| Faculty Advisor | Dr. Michael Maughan |
| Mentor | Anas Nawafleh |
| Client | Randall Fielding, Idaho National Laboratory |
| Team Members |
|
The goal of this project is to create a small-scale tensile testing system for Idaho National Laboratory with the capability to perform high-temperature tests that can be easily installed in a glovebox.
Problem Definition[edit | edit source]
Background[edit | edit source]
Idaho National Laboratory is currently researching a Uranium-Plutonium-Zirconium alloy as a potential solid fuel for nuclear reactors. While some testing has already been done, there is still much more to learn, particularly about the mechanical properties of the alloys. Due to its radioactive nature, any test performed on the U-Pu-Zr alloy must be done in a glovebox for safety, hence the need for a glovebox-based tensile tester. Our machine will enable INL to further their knowledge of this alloy and its potential usefulness. There are many models of tensile tester that already exist, but none meet the requirements set by INL. Many of these machines, especially those with the capability to perform high-temperature tests, are much too large and complex to be used in a glovebox. The models that are small enough are designed for much smaller loads than required for this device and cannot heat testing samples.
Deliverables[edit | edit source]
At the end of this project, we will have a functional tensile testing device that meets the requirements of INL. We will also create detailed instructions for the assembly of the device inside the glovebox, as well as usage instructions for performing tests and operating the heater.
Requirements[edit | edit source]
| Constraint | Goal |
|---|---|
| Assembly | Fit disassembled parts through 8" diameter port in glovebox and easily reassemble parts inside |
| Size | No more than 1'x1' base |
| Applied Force | >750 lb (~3400 N) |
| Specimen Temperature | Up to 700 C (~1300 F) |
| Surface Temperature | No more than 50 C (~120 F) |
| Lifespan | 100 cycles |
In addition to these, there were some more qualitative requirements. The device had to:
- Provide accurate data regarding sample extension and applied force
- Be capable of running a test from outside the glovebox after initial setup of sample and heater elements
- Contain all external electronic components and controls in one location, ideally with a control panel for the ease of the user
- Be visually appealing. While not a hard constraint, we wanted our machine to look more like a finished product than a rough prototype. We did this through painting and using a box to manage electrical systems
Design Considerations[edit | edit source]
The main limitation of the glovebox is a size constraint. Not only is there limited space inside the glovebox, but whatever we design has to fit through an 8” diameter hole so that researchers at INL can install it in the glovebox. On top of that, the system must be able to perform high temperature tests up to 700 C. Due to the radiation inside the glovebox, as many of the electronic components need to be outside as possible. The glovebox does have passthroughs that enable this. For the safety of the user, no external surface can exceed 50C, so some form of insulation will be needed around the heating chamber.
Project Learning[edit | edit source]
Tensile Testing[edit | edit source]
Tensile testing is used to measure certain mechanical properties of a material. The test is performed by pulling on a sample until it fractures and measuring the sample’s behavior. Measured data from the test is then used to generate a stress-strain curve. There are numerous properties that can be found through tensile testing. The first is a stress-strain curve, which plots the relationship between the stress and strain in a sample during the test. The stress is a measure of the force applied over the cross-sectional area of the sample (<math>\sigma=\frac{F}{A}</math>). The strain measures how far the sample elongates during the test relative to its original length (<math>\epsilon=\frac{\Delta L}{L_0}</math>).
The linear portion of the graph is known as the elastic region, in which the material will return to its original shape after the load is removed. The slope of this line is known as Young’s Modulus. Past the yield strength, any deformation is permanent. Also of note is the ultimate tensile strength (UTS), which is the maximum stress that material can withstand. Finally, the fracture stress is the point at which the sample breaks.
ASTM Standards[edit | edit source]
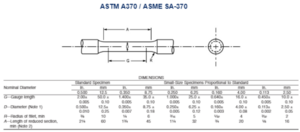
The accepted standards for tensile tests for metals are ASTM A370 and ASTM E8. These specify test methods and specimens for a valid tensile test. While at its most basic, a tensile test is simply applying a pulling force to the sample, these standards lay out practices to ensure accurate testing and acceptable results. First, the force applied must only be axial, otherwise there is a torque applied and the test is not purely tensile. This is ensured by properly aligning the sample in whatever grip or mounting system is used. Second, the speed of the test must be slow enough that accurate data can be collected. This would be done in the code for controlling the motor. ASTM A370 also specifies sample geometry and manufacturing methods. Due to the small scale of our testing machine, we opted to use the smallest sample geometries available, namely the 2.5mm and 4mm diameters. This was eventually changed to only the 2.5mm to ensure that our machine could apply enough force for fracture. The samples that would be used at INL would have to be manufactured in the glovebox. This would be done by initially casting them to size, followed by turning on a manual lathe, then sanding to final size.
U-Pu-Zr Alloy[edit | edit source]
The existing research on U-Pu-Zr alloys has been summarized in a paper by Janney et al.[1] The paper gives data from previous studies about the thermal and mechanical properties of certain weight percentages of the alloy. While many properties are discussed, the most useful for our purposes was the tensile information. Results for twelve samples were given, including ultimate tensile strength, yield strength, and Young’s Modulus. Unfortunately, the data is minimal and often inconsistent between sources. These samples are in the range of U-(10-20)Pu-(5-15)Zr. For this project, INL asked us to focus on alloys in the U-(20-30wt%)Pu-(10-20wt%)Zr range for which there is no existing data. There is no clear relationship between the weight percentage and any material properties. On top of that, the range of values varies greatly between researchers, making it difficult to estimate what force would be needed for a fracture test.
Maximum Force Calculations[edit | edit source]
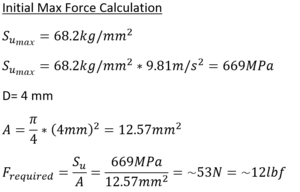
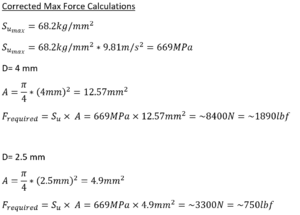
Initial force calculations were performed based on previous tensile data from Janney et al. and a specified sample geometry from ASTM A370. Since we did not know what strengths to expect, we based our design on the smallest and largest ultimate strength of any weight percentage of the alloy that we had available. We figured that this would ensure our device could sufficiently handle a wide range of varying material strengths. The ultimate tensile strength was given in kg/mm2, which had to be multiplied by gravitational acceleration to get units of MPa, which could be multiplied by the cross-sectional area of the sample to find the maximum force that would be required.
During initial calculations, we divided the stress by area instead of multiplying it by the area. These calculations were not checked thoroughly. This meant we dramatically underestimated the maximum force that would be required. The max force ended up being around 1890 lbf on a 4 mm sample, much more than the 12 lbf we believed we were working with initially.
Initial Design[edit | edit source]
ES20 Test Stand[edit | edit source]
The Mark 10 ES 20 Test stand. This is a vertical test stand that utilizes a hand crank to operate the cross head and apply force to the system. The idea was to exchange the hand crank for a motor for and automated test. The system could easily be disassembled to fit into globe box via the 8-inch glove port. The major limitation of this stand was the maximum test load of 100 pounds of force. There was some question as to what part of the frame was the limiting factor. After some analysis it was decided that this was not a valid method of conducting the tensile test that was wanted from our client. The alternative to this concept was to design a system from the ground up. This provided an opportunity to design the system in a fashion that it would be able to withstand any force that might be needed.
Sample Grips[edit | edit source]
An original idea for the grips was to have them be designed like the claw on the hammer with no bracing. This was deemed to not be strong enough to stand up to the force of a tensile test. To fix this the design was moved to a pocketed design that would be able to complete a tensile test with out fracture.
Initial Heater Design[edit | edit source]
When it came it designed a multi material heating unit in such a compact form, the challenge lay in melding effective uniform heating with the durability needed to survive the required number of tests. The heater needed to be able to heat quickly, retain heat inside the core, and reduce the surface temperature of the entire heater to within the safety limit of 50°C in accordance with INL protocol. The second greatest challenge this component of the project presented was its size and shape. Since we wanted the heater to be a single installable component, its total footprint had to be able to fit through and 8-inch circle.
The first shell design we were considering was a rounded shape to maximize the space and ensure a uniform heating profile inside the core. This design would utilize steel ducting pipe between 6 and 8 inch in diameter. The furnace core would also be in a circular shape to fit snugly inside the shell and make maintain its position relatively easy. This shape ended up getting set aside due to a lack of pre-made metal tubes available and the difficulty presented in modifying one if it had been found.
The second design we considered was to create a pattern in SolidWorks and purchase sheet metal to be cut out and bent into a steel box shell. This would allow us to easily configure the inside layers in any number of ways, allowing us to test different material combinations to optimize the heating capacity and temperature reduction features. All the hardware required would also be able to be mounted to the shell surface given the plethora of flat surfaces. This design also would allow us greater flexibility in locating the temperature controls and sensor pass through holes.
We had considered 2 options for the heater configuration that we theorized would be sufficient. We needed materials that had very low Thermal Conductivity but could withstand the high temperatures this system was going to be subjected too. Regardless of the insulating liner setup, we knew that we needed an inner core that would trap the heat and maintain a specified temperature. Research into conventional furnaces used for heated tensile testers commercially available resulted in the consideration either castable refractory cement or precast ceramic tubes as the inner core for the heating chamber. The refractory cement had the benefit of being castable into any configuration we desired, with the ability to cast fasteners and junction points directly into the chamber without having to modify or mill the brick post-casting. Precast ceramic cement tubes, while presenting the difficulty of milling and modification, had a lower thermal conductivity than the cement. This difference would increase the efficiency of the system and decrease the resulting surface temperature of the heater shell.
The first core and liner configuration we considered was to integrate a ceramic insulation blanket in between the refractory cement and the steel shell. Ceramic wool blankets have great insulating properties and low thermal conductivities due to the low density and high porosity of the blanket. The silica in the blanket has low thermal conductivity and the blowing process used to create the blanket places a large quantity of small air pockets in the blanket itself. This configuration would use the blanket to sandwich the cement chamber into the center of the shell and could be extended on either side of the shell to act as an insulating gasket between the two faces of the heater.
The second core and liner configuration we considered was to utilize the great thermal properties of near-still air only. Air itself can serve as a good insulation material when the air is not turbulent. If the two halves of the shell were able to be secured using spacer pins mounted into the refractory cement itself and the two haves were sealed well with an insulating contact gasket when closed, the air inside the shell itself would not be moving much at all. This air in this state would then act as an insulating material and limit the amount of heat transferring from the outside of the refractory cement core to the steel shell to mostly heat transfer by radiation.
Final Design[edit | edit source]
Corrections From Prior Design[edit | edit source]
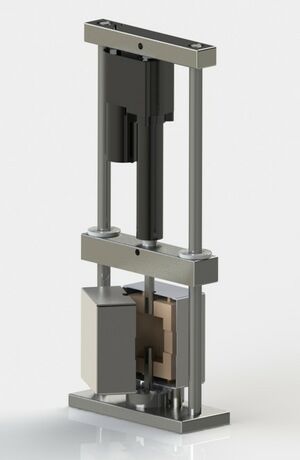
The ES 20 was unable to perform a test at the forces that were required of our specimen. To combat this we moved to designing our own version. We achieved this by moving the driving mechanism and the load to be aligned in the center of the frame.
Final Frame Design[edit | edit source]
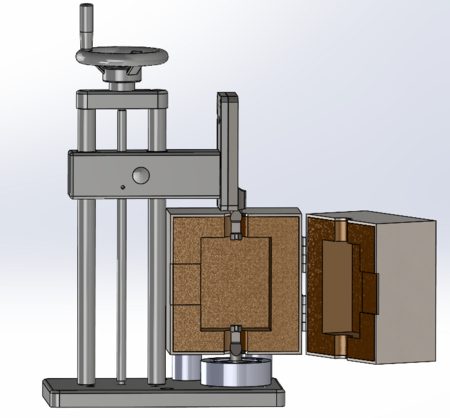
The frame is designed to be self-standing and able to be assembled through the 8-inch glove port. The support for the system is the 1-inch diameter guide rods made of case hardened 1566 steel. These are clamped to the base plate and top cap via nuts on the ¾-13 threaded ends of the guide rods. The guide rods also provide the total height of the system of around two and half feet tall. The guide rods connect the top cap and base plate of the system. The top cap is 2 inches wide by 1.5 inches tall 1045 steel cut to 12.5 inches long. It has pass through holes for the guide rods and linear actuator power cable. The final feature of the top cap is the pocket for attaching the linear actuator complete with a hole for a pin to secure the linear actuator. The base plate is 5 inch wide 1-inch-tall piece of A36 steel the same length as the top cap. It also has holes for the guide rods to attach to as well as holes in the same pattern as the load cell which is bolted to the base plate. It also has holes meant to mount the heater. The penultimate part of the design is the cross head also A36 steel 2.5 inches wide and 2 inches tall. The crosshead also has a pocket to accept the moving end of the linear actuator. It mounts to the guide rods via linear motion bearings which are bolted into the cross head. The final feature of the cross head is a hole threaded to ½-20 to accept the grips. The grips screw into the load cell and the cross head and grip the sample via the shoulders of the reduces section of the specimen.
Linear Actuator[edit | edit source]
In determining the power source of the test stand it was a choice of simplicity as a linear actuator could be purchased with the capability of providing more than twice the force that would be required to fracture the specimen. This came at a monetary cost but provided a premade reliable drive mechanism.
Final Heater Design[edit | edit source]
After deliberating on the pros and cons of the potential Heater configuration and insulation material selection, we decided to purchase 18gauge mild steel sheet metal for the heater shell. Mild steel has strength and low cost. The metal was readily available locally, saving us money and time on shipping. We were able to purchase exactly the dimensions we needed, and the James Martin Lab in the College of Natural Resources was able to utilize a dxf drawing file produced from our SolidWorks rendering of the shell to cut out the pattern using the CNC Plasma Cutter. As stated above, we needed a refractory cement for maintaining a consistent interior temperature, and we chose Rutland refractory cement that could withstand temperatures up to 2200°F (1200°C). For the insulating temperature reduction liner between the core and the shell, we chose to use still air. This decision was reached due to the dimensional limitations of commercially available ceramic wool, as we could not find a thickness that would work with the heater size limitations.
Final Grip Design[edit | edit source]
From the initial grip design support was added to prevent bending moments resulting in the final pocketed design. This also allows for the design to maintain the same stock size that the original part would have needed. The final edit that was made was to make both grips threaded so that they were identical.
Circuit Components[edit | edit source]
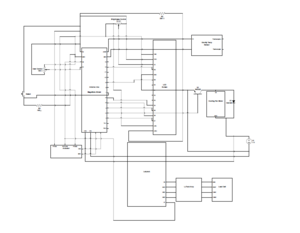
The diagram (right) shows how each component of the control system is integrated to either the Arduino Uno and MegaMoto Shield used to control the actuator and independent sample temperature sensor. The thermocouple probe is connected to the Arduino 5V output and ground, with the C pin connected to the Arduino SCL and the D pin connected to SDA. The 12V power supply is connected ground to – and 12V to + on the shield, with the pwmA connected to the linear actuator hot, and pwmB connected to the actuator ground. The linear actuator potentiometer is connected yellow to ground, white to 5V, and red (communication) to the Arduino pin A0. The selection potentiometer is also connected to gnd and 5V in the same manner, with its communication pin connected to the Arduino pin A1. The LCD display monitor is wired as clearly shown below with a separate potentiometer used for brightness control that is not connected to the Arduino directly. The motor fan, wired through a P2N222 diode and Mosfett as shown, with the pwm speed control set in the code. The crosshead displacement information is transferred to the LabView VI through the communication pin branching into the LabJack.
User Control Interface[edit | edit source]
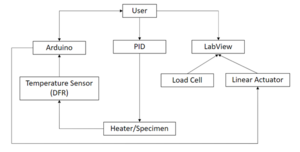
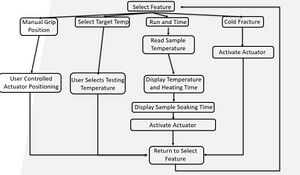
The user interface for the tensile testing system is house inside of a control box, which has the main purpose to house all user interface interactions. The figure below shows the flow chart of how the user will be able to control the system through three major components: LabVIEW, Arduino, and the PID temperature controller.
The Arduino will allow the user to select different outputs which can be seen in the Arduino code architecture below. This will allow the user to choose settings and be able to gather temperature data from the temperature sensor (DFR) and display the specimen temperature via the Arduino window on the user's computer. The PID will allow the user to choose the nichrome wire temperature and allow the user to monitor the temperature on the same screen of the PID. This be directly affecting the DFR sensor read by the Arduino. LabVIEW will be gathering data from the load cell and linear actuator to capture and read the data of the specimen after and during the test.
PID Heater Control System[edit | edit source]
Temperature Control Concept:
When developing the concept of the temperature control for our heating chamber a Proportional Integral Derivative (PID) controller was always the main concept for user control. Finding a PID was the most difficult part, with so many different components and wiring schemes this led to many concepts that would work for our design and needs. Many PID systems, when heating a nickel chromium wire to high temperatures can lead to PID run off which can prove to be an extreme danger to the user. This was brought to our attention during a snapshot check in and during our design review which led us to choosing the following system.
The initial concept was to use two separate PID setups, one for each side of the heater connecting to two different nickel chromium wires. This concept was decided to be the best one among the team which was the basis concept when coming up with the products needed. This led to researching a Solid-State Relay (SSR), a PID, an emergency stop switch, thermocouple, and any accessories or attachments that are required to run the system. Due to the runoff possibility of the nichrome wire we decided to use an emergency stop switch to quickly cut off power to the system, as well as integrating a toggle to cut off power directly to the nichrome wire. When finding the correct nichrome wire to select we had to research different gauge wires to figure out which ones would use the correct current and power based on the length of wire we desired.
Once the temperature control devices have been selected, a nichrome wire needed to be selected. For this project we have started with 18 and 24 AWG wire, determined off Design Evaluation: table #, which allow calculations to begin depending on the resistance per foot [Ω/ft]. For 18 AWG wire it has properties of close to 0.5 Ω/ft which helps determine the lengths from the governing equations below:
- P= V^2*R (1)
- I= V*R (2)
- Length= (Ω/ft)*R (3)
These governing equations help determine key values, that prove extremely valuable for validation and testing. Equation () solves for power (P) in the units of watts. This uses Voltage (V), in units of volts, squared divided by the resistance (R), in units of Ω. Equation (2) is used to solve for the current (I) which is equal to the voltage over the resistance. Equation (3) is intricate to our heater design and needs to find a length between 12 [ft] and 20[ft]. If any of those uncoiled wire lengths become too short the wire will not be able to reach both inside sides of the heater. The values determined by the governing equations, (1) and (2), assist in deciding if the heater system is safe to use in standard outlets rated for 1800 [watts] and 15 [amps].
When determining the nichrome wire the calculations needed to be performed as well as performing tests to validate that system can meet the project requirements. These calculations and the validation of the system can be seen in the design evaluation section of this design report.
Temperature Control Selection:
When selecting the temperature control system, we took our initial design as previously stated in the concept consideration section and focused on integrating that system. The next design choice was to decide which products to purchase to start wiring the system. The following is the items purchased for selection:
- PID Temperature Controller: CN16D3-S-AC
- Solid State Relay: SSRL240DC50
- Heat Sink
- Fuse: 30 Amp
- Nichrome Wire: 18 AWG wire – 0.0403” diameter
- Wiring: 16 AWG copper wire
- Emergency Stop Switch: POWERTEC 71007
The components above were selected based off safety considerations and ease of understanding to meet our project requirements. The PID was selected for the autotune and alarm features, for the maximum temperature, and for compatibility of k-type thermocouple. After selecting the PID, the SSR was chosen because of the compatibility between the PID and SSR. The SSR was selected for the current it was capable of, 50 [amps]. The nichrome wire was selected from the calculations shown in the appendices: table # for both the 24 AWG and 18 AWG. The calculations show that the 18 AWG nichrome wire can reach the desired maximum temperature of 800 [C], and then through validation show the inside heater temperature can reach the desired temperature of 700 [C] without reaching above a standard outlet’s ratings of 1800 [W] and 15 [A].
Temperature Control Architecture:
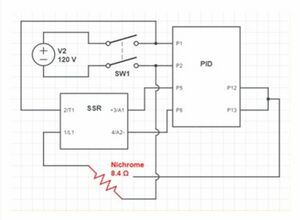
The conceptual design for the heaters temperature control system was to make one single heating system instead of two for both sides of the heater. The design is to use one single nichrome wire that will coil between both sides with a section of loose coiled wire to extend to each side. The temperature control system uses the circuit shown on the right in the figure.
PID Circuit Diagram
The diagram above shows how the PID temperature control system will be wired and function. The voltage source is a standard wall outlet connected to the emergency stop switch. From the emergency stop switch the power goes to the PID (Proportional Integral Derivative) connecting at pin 1 and pin 2. The PID has the k-type thermocouple connected to pins 11 and 12 that will be attached to the nichrome wire to read the temperature. On pins 5 and 6 on the PID is where the SSR (Solid State Relay) will be connected. The SSR will connect back to the switch while passing through the safety fuse and then the 1/L1 will connect to the nichrome wire then back to ground on the switch.
Coding Overview[edit | edit source]
Labview[edit | edit source]
Validation[edit | edit source]
Design Validation Plan[edit | edit source]
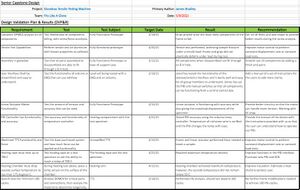
This is the process and result of our validation for the project. Many of the components that had tests performed on them were high risk components or components crucial to meeting the project requirements. To the right is the table of our design validation that shows results of tests, how the tests were set up, when the validation was performed, and the recommendations based on the results. This shows that most requirements were met.
FEA Analysis of Parts[edit | edit source]
To validate that the frame could withstand the forces of a tensile test it was put through methods of confirmation. First, they were put through finite element analysis in SolidWorks. All the pieces as manufactured in the final design could easily withstand double the force required to break the sample. The exception to this is the grips however this is due to 4the way that the simulation must be constructed. A previous version of the grips with out this issue was non-existent showed that they should not fail under double the force required to break a specimen. The second method of testing the machine was to run a mock tensile test with a 7075-T6 aluminum specimen. The frame was easily capable of breaking the sample without any of the components failing.
Temperature Validation[edit | edit source]
Nichrome Wire Validation:[edit | edit source]
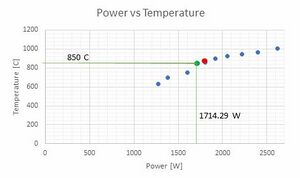
To validate the nichrome wire based on the calculations from equations (1), (2), and (3); testing needed to be performed to validate the calculated values. The calculated values for the 18 AWG and 24 AWG wire from those equations, were solved in excel and are in the Appendix A.1. From those values calculated a graph was created to show how the temperature was affected based off the amount of power being supplied. The 18 AWG wire was selected due to the lengths shown in table A.2 in the appendix. With the 18 AWG wire selected, the Figure (3) below was made to determine the maximum temperature that could be achieved while remaining below the standard outlet’s ratings.
The graph to the right shows the ideal power determined to reach 850 [C] while still maintaining a length of uncoiled wire between 12 to 20 [ft]. This can be shown in the green dot and line which show that all requirements can be met with this 18 AWG nichrome wire. The red dot shows the next resistance of 8 [Ω] lower which resulted in larger power and current value which exceeded standard outlets. The voltage from the outlet, power supply, was known to be 120 [Volts] and the resistance was measure from a multimeter to determine a resistance of 8.4 [Ω]. From the equations mentioned earlier and the graph above, the following values were obtained:
- Current: 14.2857 [A]
- Power: 1714.39 [W]
- Wire Length: 16.8 [ft]
The next step was to perform a PID temperature validation test, in which the circuit shown in diagram (#) was completed and the test was ready to be performed. The test was setup to only contain the nichrome wire and the selected PID circuit. The results led to the nichrome wire reaching a temperature of 806 [C] which validates that the nichrome can produce enough heat to bring the temperature of a sample up to 700 [C]. Following this test, the heater would need to be validated to verify the temperature of the inside heating chamber.
Heater Furnace Temperature Validation:[edit | edit source]
To validate the heating chamber, a heat transfer simulation and temperature test needed to be performed. The SolidWorks simulation, Appendix, validates that the inside chamber temperature can reach the desired maximum temperature of 700 [C] and that the outside temperature will drop as the heat goes through the refractory cement, air gap, and the heaters shell resulting in an outside surface temperature of 40 [C].
To perform the temperature test of the heater, the nichrome wire properties previous stated in the validation were used and integrated into the heater. The coiled nichrome wire was placed into the heating chamber with both ends connecting to two split bolt copper connectors that were submerged into the refractory cement bricks. In the split bolt connectors, the 16 AWG connection wire was wrapped around the nichrome wire ends then the split bolts were tightened. From there the 16 AWG wire was connected to the PID circuit. To validate the PID temperature and the inside heating temperature an Arduino gravity digital high temperature sensor (DFR 0558) was used to measure the air temperature. With the test setup complete, tests were ready to be performed.
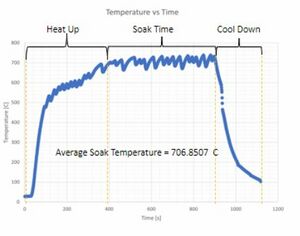
The temperature data shows the data collected and the input temperature from the PID and the output temperature recorded by the PID. Below is Figure (4) representing the data collected from the Arduino temperature sensor that is measure the inside chamber of the heater per second.
With the temperature [C] on the y-axis and the time [s] on the x-axis this shows how the heater and the PID worked together to reach a desired temperature of 700 [C]. This graph can be split into three sections.
- The Heat Up: This section shows how long the heater took to heat up to the desired temperature of 700[C]. This took roughly 7 minutes to heat up the specimen chamber.
- The Soak Time: This section shows the time spent holding the temperature at 700 [C]. With the current PID and heater set up the temperature fluctuates and does not stay constant due to the SSR being an on/off power switch. This fluctuation could be made more accurate which will be discussed in the further work section. Even with the fluctuation the average temperature of the soak time was 706.85 [C] for 8.3 minutes which meets our required maximum temperature.
- The Cool Down: This section shows the heating chamber cooling down to 100 [C] in about 5 minutes.
With the PID and the heater validated to reach maximum temperature, evaluating if the outside surface temperature of the heater shell was below 50 [C] was done concurrent with the test above. The surface temperature was measured using a laser temperature reader, with the hope to use a temperature sensing camera in further tests. The laser temperature reader found that the shell temperature ranged from 60 – 250 [C], peaking at the extensometer passageway at the 250 [C]. This does not validate our requirement which plans to fix the surface temperature will be shown Further Work section of this report.
Load Cell Calibration[edit | edit source]
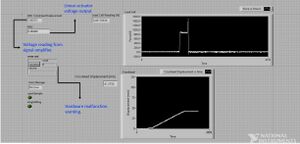
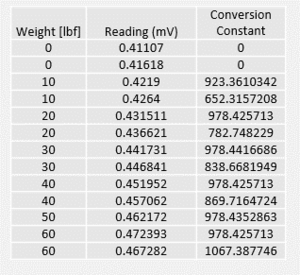
The load cell that was purchased was delivered with a calibrated TEDS connector cable that had contained a chip used to offset the voltage output to a correlated lbf reading. Due to economic constraints, we had to end up severing the connector cable and use a signal amplifier, the LJTic-InAmp from Labjack. This signal amplifier provided an excitation voltage of 2.5V. Using the factory calibrated excitation voltage multiplier of 2.5 mV/V, a load of 2000 lbf the signal change would output a .0007mV change. To calibrate and then validate the Load cell, we performed a series of static hanging weight tests and recorded the voltage output change. The load cell was inverted, and a bucket was hung from the center using a steel hook secured with a nut on the other side of the Load Cell. We performed multiple tests using 10lb weights to determine the mV value that correlated to a 10lb tensile load. We determined a conversion value of 978.4 per mV to equal 1 lbf load.
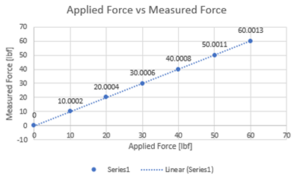
The same test fixture shown above was used to do a random series of weight combinations using the same 10 lb weights used in the calibration stage to determine the validity of the offset. As shown by the graph below, the multiplicitive factor of 978.4 in combination with the 261-to-1 signal amplification produced an accurate reading with a margin of error less than .02%
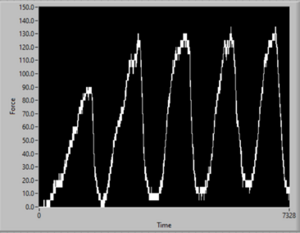
Additionally, we utilized the bodyweight of one of the team members to test the real-time loading response of the actuator-LabVIEW integration. Shown on the graph below, the individual placed their person inside the bucket and cyclically applied their weight as a tensile load. Not only did the graph respond in time to the weight application, but the peaks lined up with the expected maximum weight.
Aluminum Test Specimen[edit | edit source]
To do final validation of our design we created aluminum versions of the test specimen. These specimen were made from 7075-T6 Aluminum as it is a common material with data known about its tensile properties. These were made from quarter inch round stock with a reduced section that is a tenth of an inch in diameter with a 30 degree chamfer to reduce the stress concentrations in the shoulder of the specimen.
Recommendations for Future Development[edit | edit source]
Great strides were made in this project, and a solid frame capable of snapping a metal specimen was produced. Due to the overarching complexity of this project and shipping constrains introduced due to Covid-19, the following tasks should be undertaken to bring the project into complete fruition. Tasks:
Functionality
A. Integrate Extensometer a. The remaining component required to bring the tensile tester into operational status is the extensometer used to measure micro strain, determining the true elastic limit of the sample. The extensometer we ordered from Epsilon Tech did not arrive until three days before the end of the semester. This integration process is estimated to take 20 hours for completion but should not carry any additional cost. Calibration and Validation A. Validate Extensometer Reading a. To validate the extensometer upon integration, multiple tensile tests should be conducted using stainless steels with Ultimate Tensile Strengths ranging from 500MPa to 1000MPa. This range encompasses the possible UTS values of the experimental samples. Test results can then be analyzed and compared to published material property curves. This task is estimated to require 40 hours to complete, with 10 hours for sample manufacturing, 15 hours for fracture testing, and 15 hours for data analysis. If proper sample material cannot be found in the scrap bins on campus, this step could cost an additional 50$-100$.
B. Characterize Heating Routine a. Standardized samples should be brought to a temperature within the previously described range and held until the sample’s temperature is homogenous. The time taken for each sample to reach this temperature will be used to develop a function estimating the required time to soak the experimental samples to the desired temperature. This task should take no more than 20 hours to complete and should not carry any additional cost.
C. Characterize Machine Compliance a. A mathematical model should be developed to analyze the individual components of the machine. Results from the math model can then be used to identify and account for all stress and deflection contributions originating from the test fixture. Preload, the force exerted on the sample to remove slack, will be combined with this data, and produce accurate corrected displacement and load data. D. Validate Prototype Functionality a. Prototype validation should be performed using the same materials chosen in previous steps, heated to random temperatures within the previously described range and tested through fracture with the extensometer attached. The results of the tests can then be analyzed and compared to published and validated results.
Safety
E. Validation of Surface Temp Safety a. During the first temperature controller tests we performed, the surface temperature in multiple spots far exceeded the safe operating surface temperature by 50-200 °C. Alternate insulating materials should be researched and implemented with multiple tests being conducted by setting the validated temperature controller between 200°C to 850°C for the time values previously determined to bring the chosen samples to a homogenous temperature. The surface temperature will be recorded during the heating process to ensure it does not exceed an accepted limit of 50°C. If the temperature cannot be maintained at or below 50°C, an additional heat shield will need to be fabricated and installed to bring the surface temperature down to the previously designated target surface temperature limit. This task is estimated to take 10 hours for surface temperature testing and material selection, with an additional 15 hours for heat shield fabrication and installation. This task may carry an additional cost to the sponsor in the range of $50-150$
F. Develop Overheating Safety Automatic Shut-off a. The installed PID model is equipped with warning features limited to audio warning. To provide redundancy in safety features, a heat sensor comprised of a thermocouple and temperature reading module will need to be integrated to monitor the temperature of the heating coil independent of the PID temperature controller. If the temperature exceeds a pre-defined value (the maximum operational temperature set by the user), an independent relay in series with the main power supply line should be triggered, shutting off all power to the heating system, preventing catastrophic failure due to thermal runaway or thermocouple failure. This task is estimated to require 20 hours to complete. The only additional cost produced by this feature is the 20$-40$ necessary to purchase the correct relay switch.
G. Develop Product Operation and Debugging Documentation a. To prevent personal harm due to improper usage, documentation detailing all aspects of assembly, operation, calibration, and safety features will be compiled. This documentation will include any potential failure modes and the correlative corrections necessary for on-site troubleshooting. Additionally, it will instruct the user in the operation of the machine, highlighting safety protocols and operational options available to the user. This particular task requires the full system to be operational, and thusly cannot be completed without the previously listed future work. This task is estimated to take 20 hours to complete.
Team Members[edit | edit source]
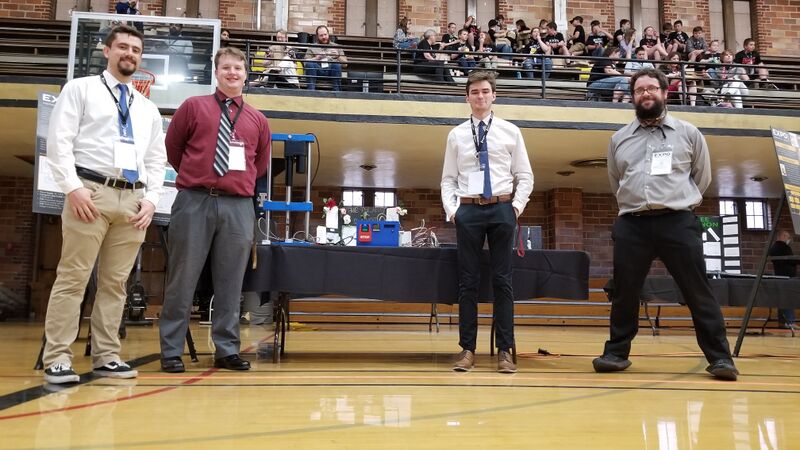
Team members from left to right:
Matt Uptmor
Major: Mechanical Engineering
Hometown: Meridian, ID
Responsibility: Scheduling, Wiki Master
Email: uptm3100@vandals.uidaho.edu
Logan Matti
Major: Mechanical Engineering
Hometown: Redding, CA
Responsibility:Budgeting
Email: matt3733@vandals.uidaho.edu
James Bradley
Major: Mechanical Engineering
Hometown: Sandpoint, ID
Responsibility: Project Manager
Email: brad4056@vandals.uidaho.edu
Jared Gray
Major: Mechanical Engineering
Hometown: Boise, ID
Responsibility: Client Contact
Email: gray6722@vandals.uidaho.edu
Additional Documentation[edit | edit source]
Project Schedule
Meeting Minutes
[Fits Like a Glove Meeting Minutes Document]
Presentations
File:2020 FitsLikeaGlove Snapshot1Presentation.pdf
File:2020 FitsLikeaGlove Snapshot2Poster.pdf
File:2021 FitsLikeaGlove Snapshot3Poster.pdf
File:2020 FitsLikeaGlove ConceptDesignReview.pdf
File:2021 Fits LikeaGlove EngineeringReleaseReview.pdf
File:2021 FitsLikeaGlove TechnicalPresentation.pdf
File:2021 FitsLikeaGlove ExpoPoster.pdf
References[edit | edit source]
- ↑ Dawn E. Janney, Steven L. Hayes & Cynthia A. Adkins (2020) A Critical Review of the Experimentally Known Properties of U-Pu-Zr Alloys. Part 2: Thermal and Mechanical Properties, Nuclear Technology, 206:1, 1-22, DOI: 10.1080/00295450.2019.1623617
